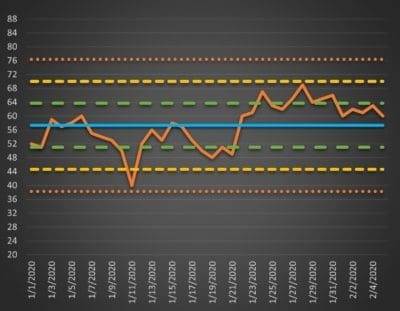
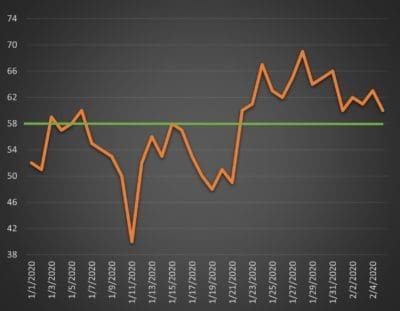
Courses

Free Tool Run Chart

Run Chart

Free Quality Tool Lesson! In this module, you will learn to create and interpret a Run Chart. The Run Chart is an essential tool for understanding process performance. The chart makes variation over time visible. This lesson includes: One 8 minute video References and resources can be accessed in the Materials tab at the top […]

Run Chart Read More »

Control Chart Free Lesson

Control Chart

Free Quality Tool Lesson! In this module, you will learn how to create and understand a Control Chart. The Control Chart is the best tool for determining process stability and for verifying that a change to the process resulted in improved performance. This lesson includes: One 15 minute video References and resources can be accessed

Control Chart Read More »

Causal Tree

Causal Tree

Free Quality Tool Lesson! In this module, you will learn how to use a tool called a Causal Tree to find the factors and conditions that lead to actions, which collectively cause problems. The causal tree is a tool for investigating all of the factors and conditions that allowed a cascade of actions to cause

Causal Tree Read More »

Free Tool Fishbone

Fishbone Diagram

Free Quality Tool Lesson! In this module, you will learn how to create and use one of the seven basic quality tools. This tool is called the cause and effect diagram or the Fishbone. The Fishbone is used to discover the many causes of a single problem and to isolate those with the greatest effect..

Fishbone Diagram Read More »

Full-Level: Developing a Quality Management System

6.0 Contact hours ($59.99) Developing a Quality Management System for the Manufacture of Laboratory Developed Tests! In this course, we explore the expansive industry that produces laboratory tests, reagents and protocols required to detect and treat illnesses referred to as “Laboratory Developed Tests (LDT). We discuss the history of LDT and the rationale behind the

Full-Level: Developing a Quality Management System Read More »